Tableau Presentation
| Introduction to Tableau | ||
|---|---|---|
| Tableau is a powerful data visualization tool. It allows users to easily connect to various data sources. Tableau helps users analyze and present data in an interactive and visually appealing manner. | ||
| 1 | ||
| Key Features of Tableau | ||
|---|---|---|
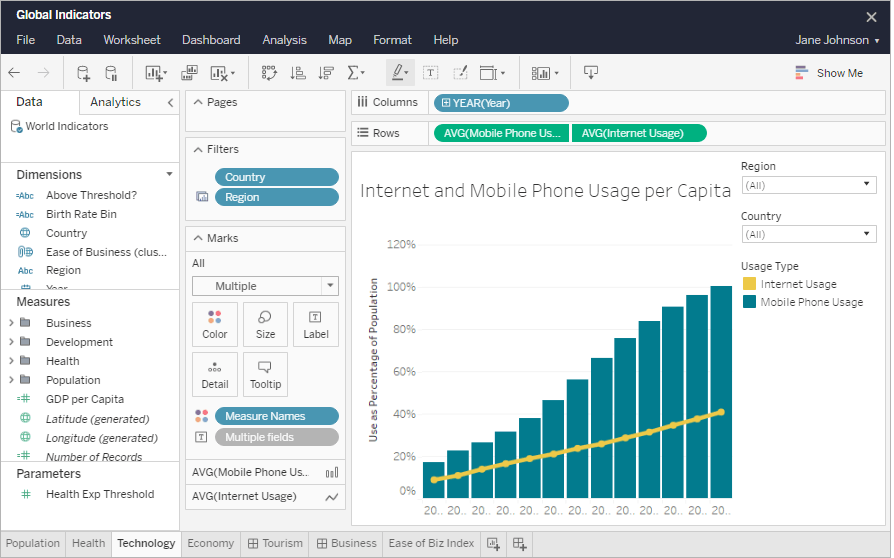
| Drag-and-drop interface enables quick and easy creation of visualizations. Ability to create interactive dashboards and reports for real-time data analysis. Seamless integration with various data sources like Excel, databases, and cloud platforms. | ||
| 2 | ||

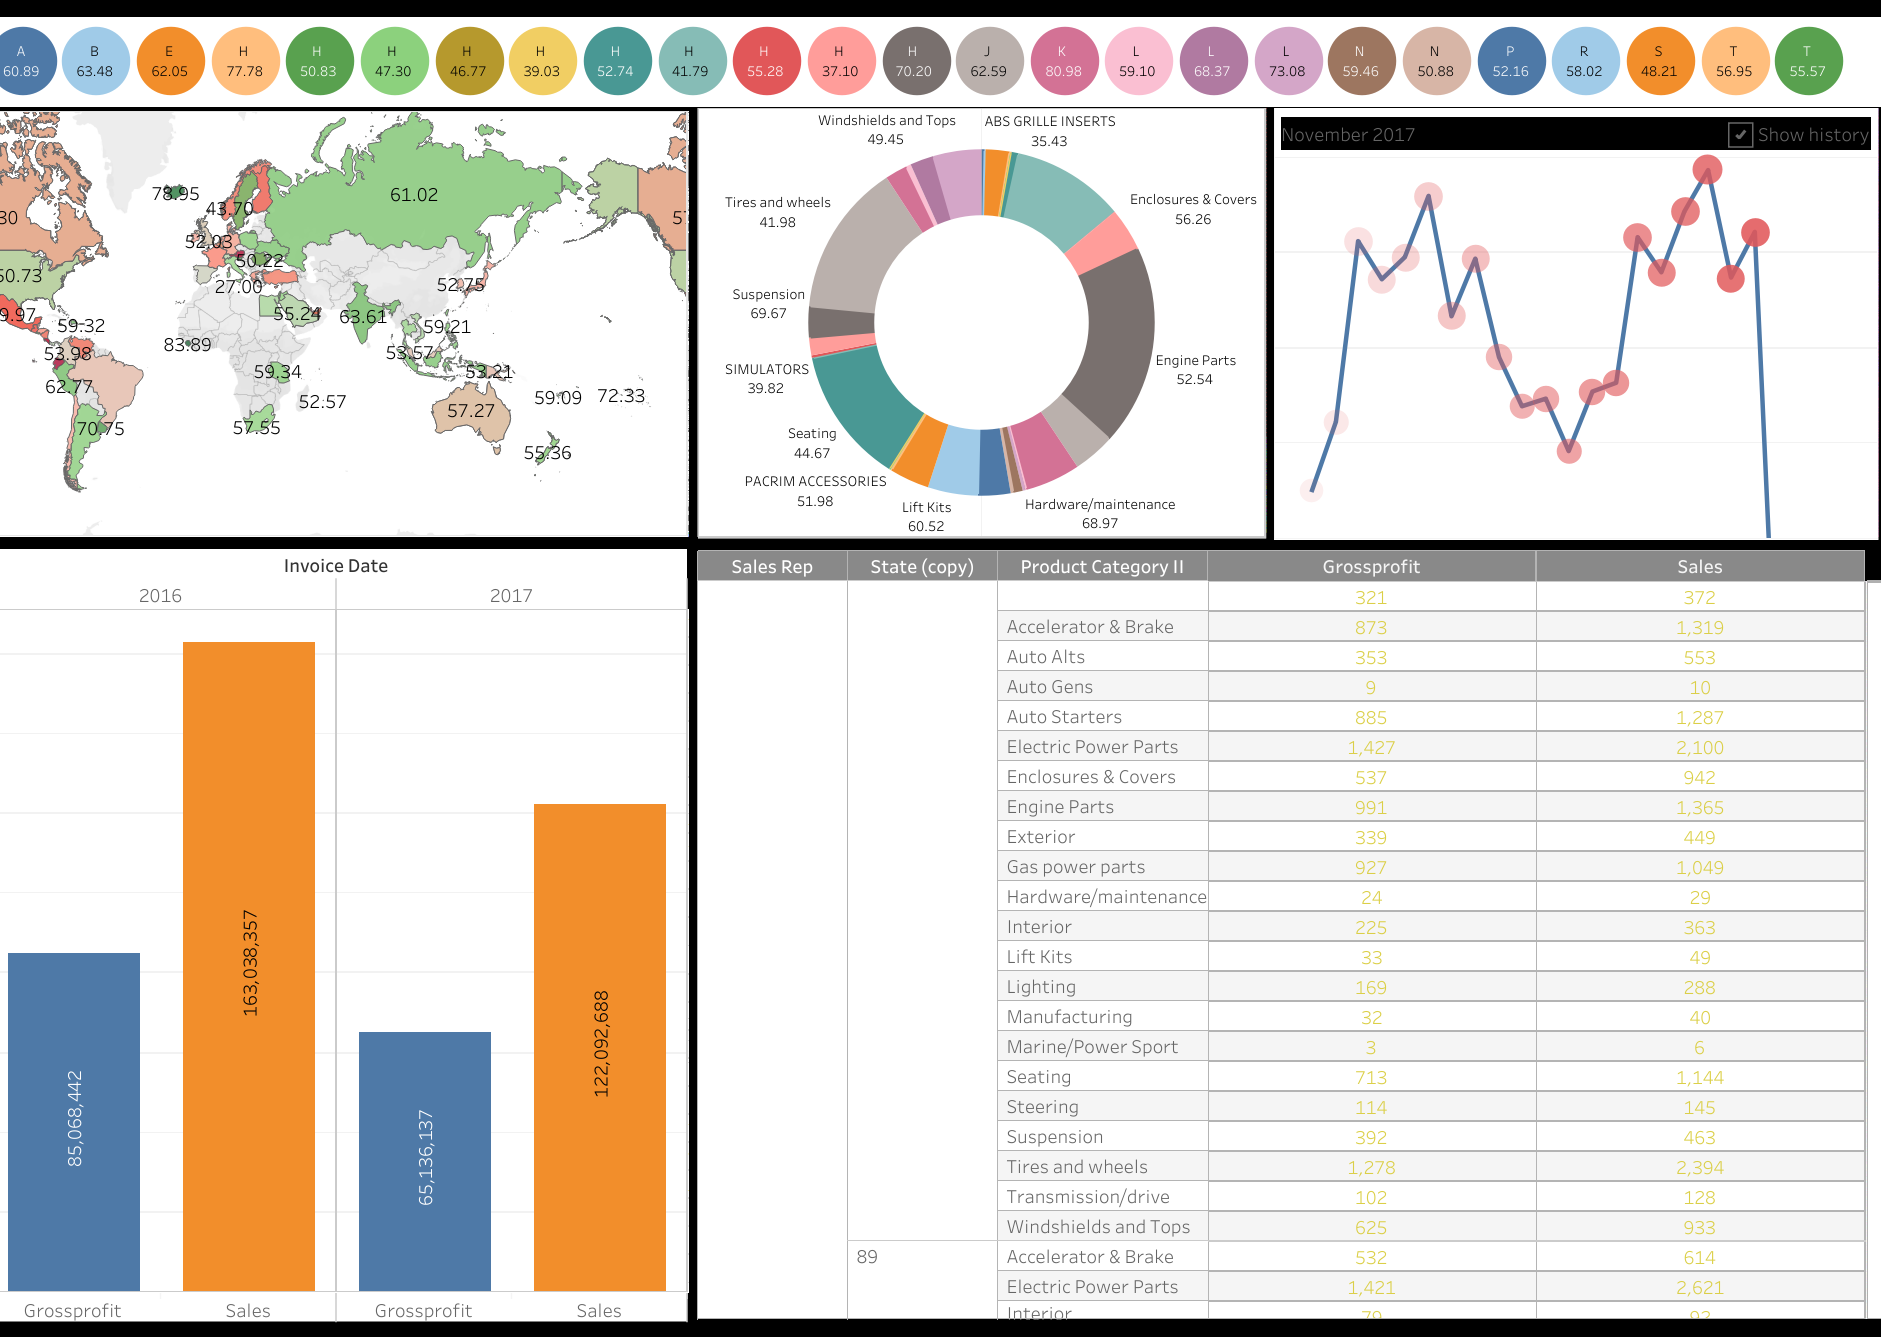
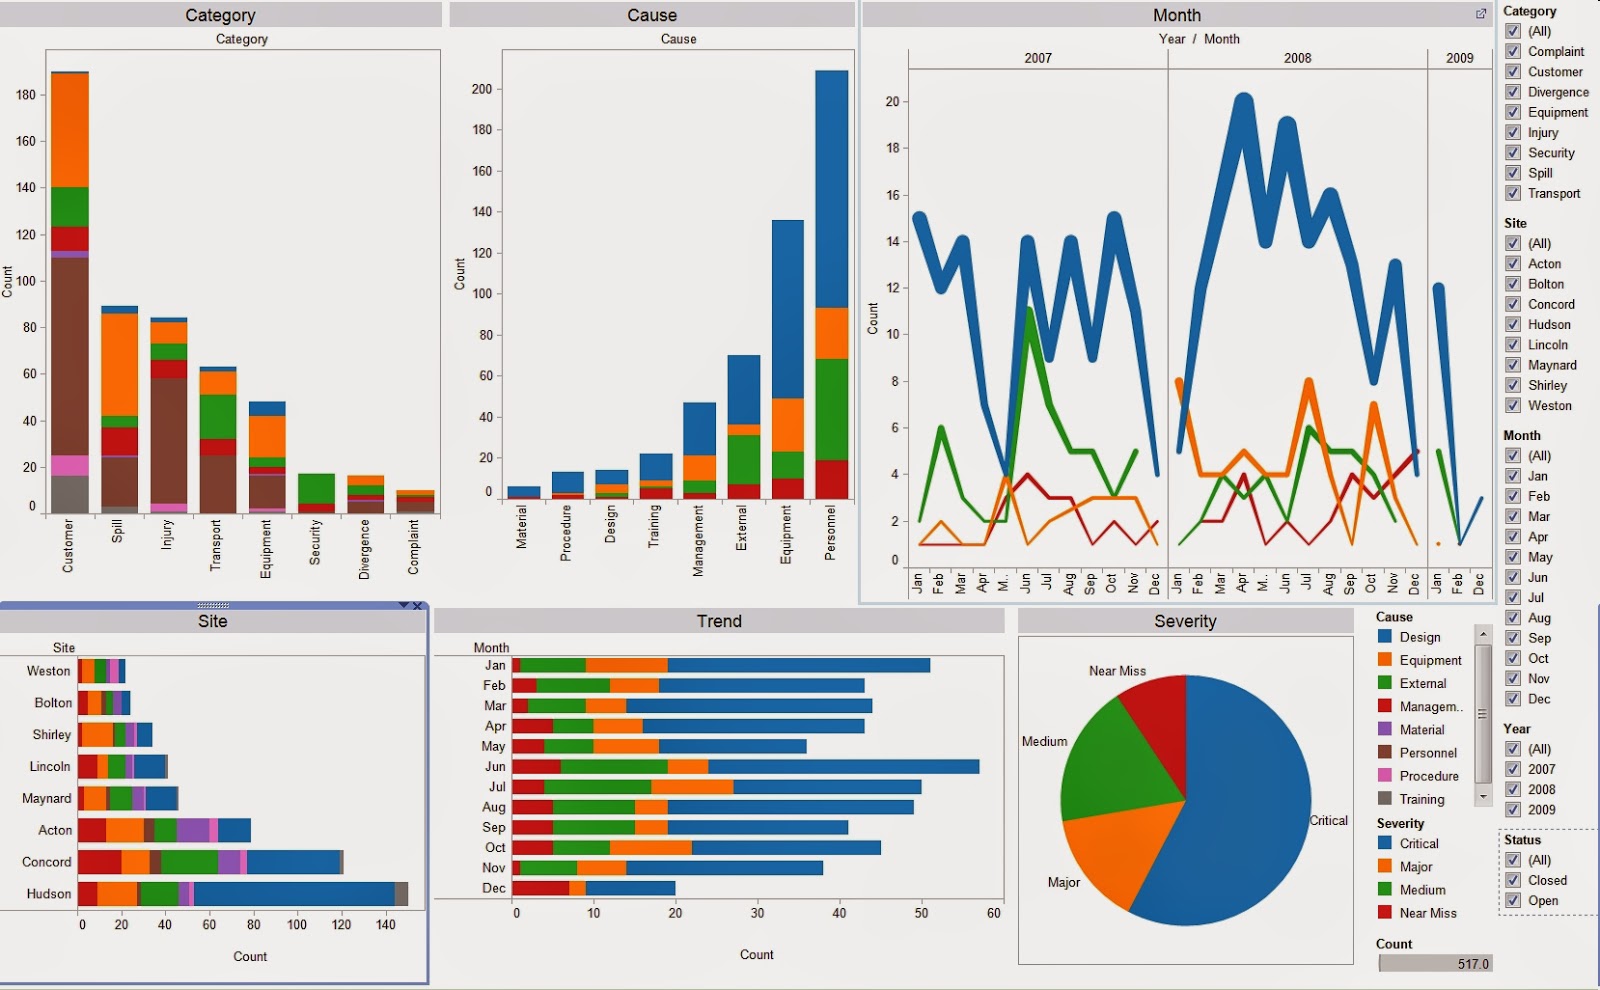
| Data Visualization Capabilities | ||
|---|---|---|
| Tableau offers a wide range of chart types, including bar charts, line graphs, scatter plots, and maps. Users can add filters, hierarchies, and parameters to create dynamic visualizations. Tableau's advanced analytics features allow users to perform calculations, forecasts, and trend analysis. | ||
| 3 | ||

| Collaboration and Sharing | ||
|---|---|---|
| Tableau allows users to collaborate by sharing dashboards and reports with others. Users can publish interactive visualizations to Tableau Server or Tableau Public for wider distribution. The web-based interface makes it easy to access and share visualizations across devices. | ||
| 4 | ||
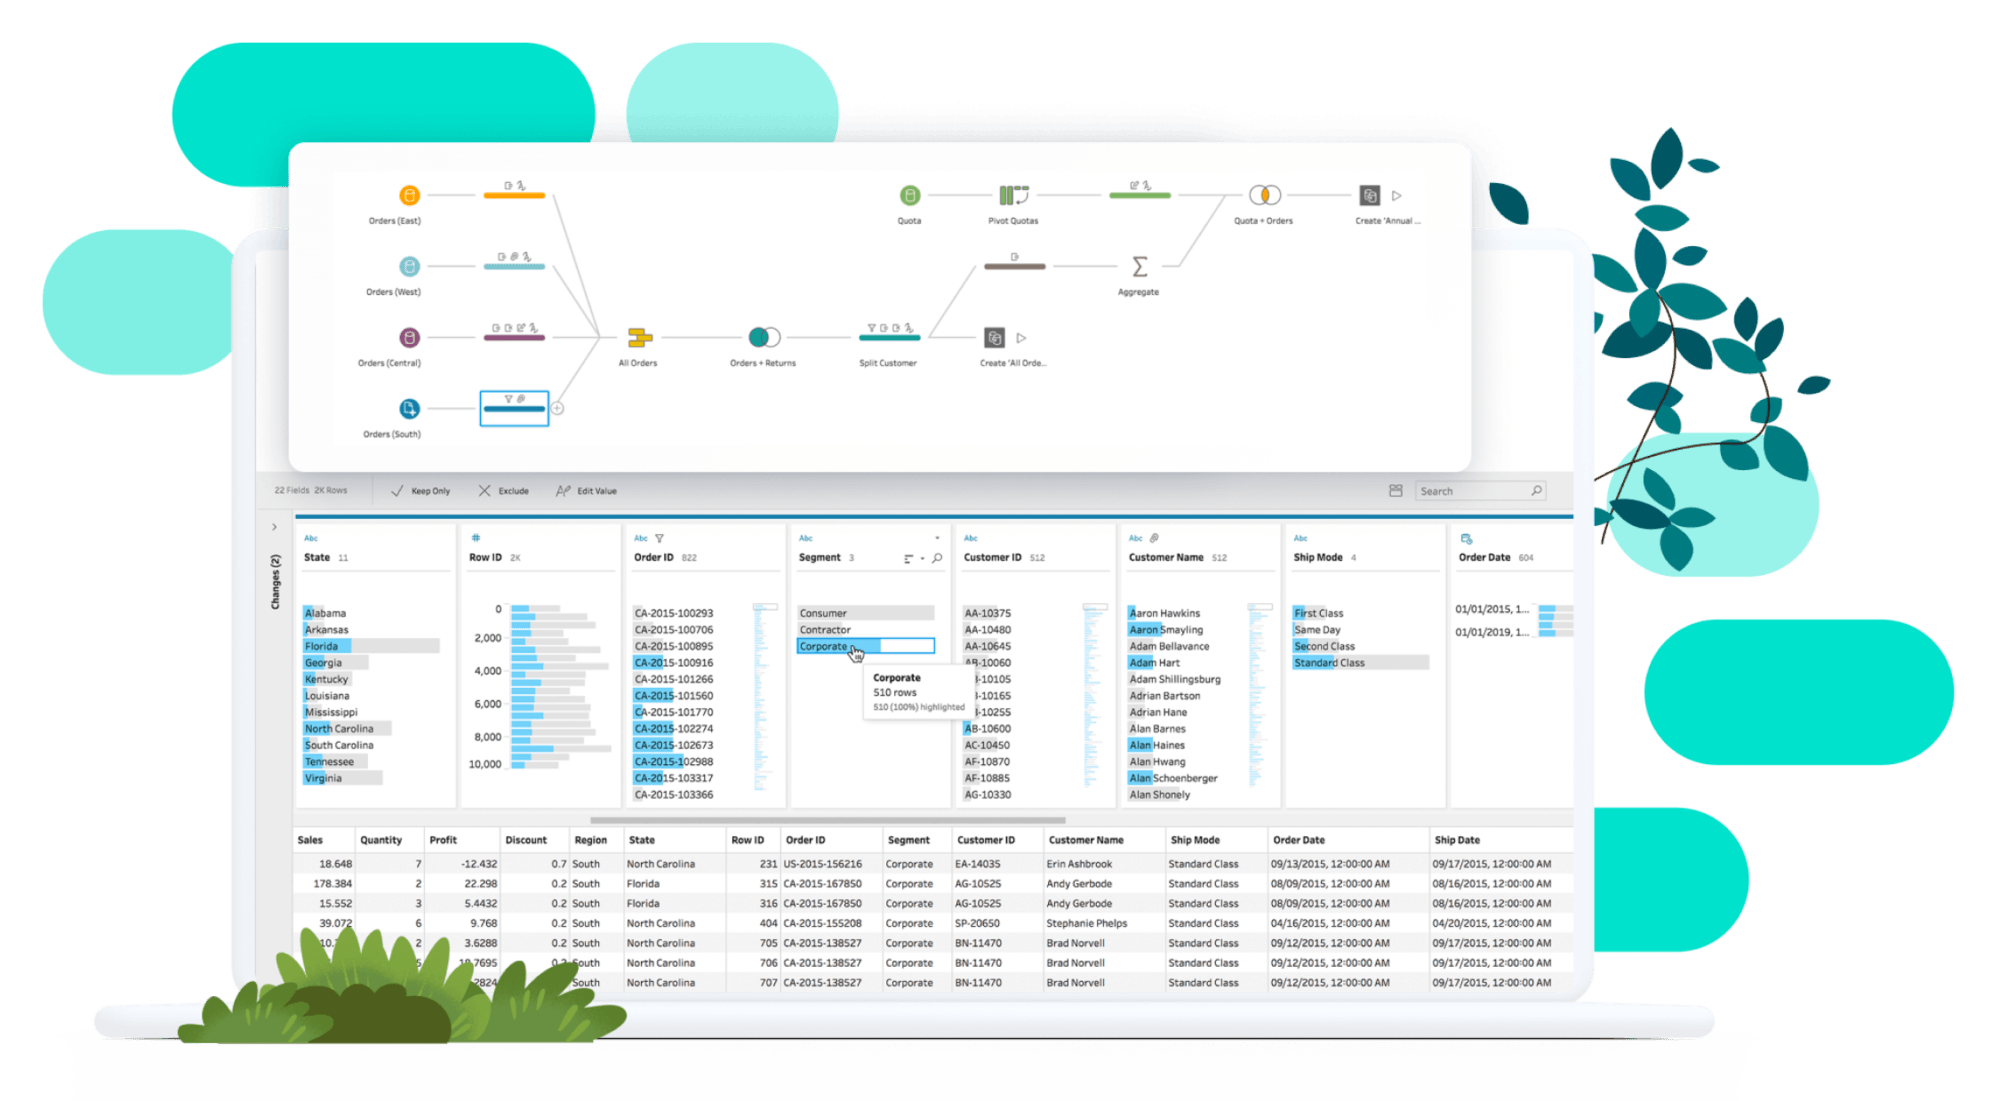
| Data Preparation and Integration | ||
|---|---|---|
| Tableau provides a range of data preparation tools to clean, transform, and blend data from multiple sources. Users can join, union, or pivot data to create a unified view. Tableau's data connectors enable seamless integration with popular data sources. | ||
| 5 | ||
| Integration with Advanced Analytics | ||
|---|---|---|
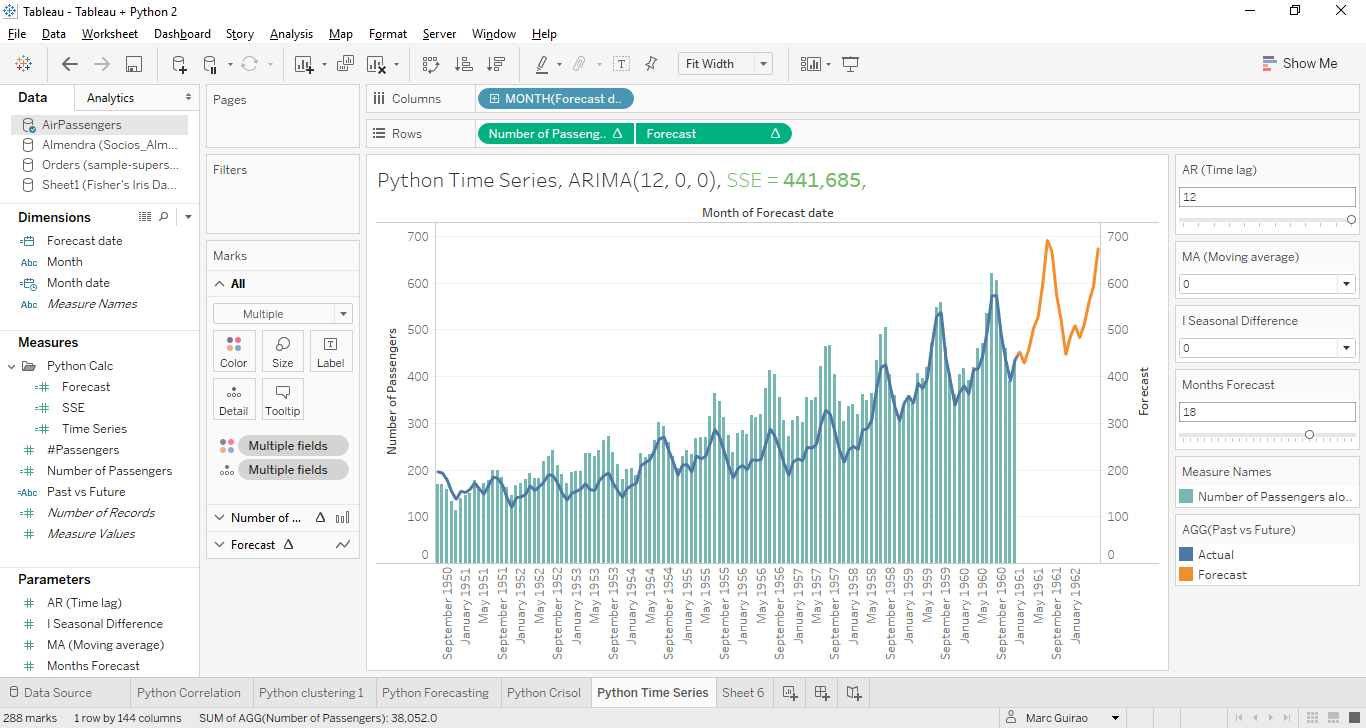
| Tableau integrates with R and Python for advanced statistical analysis and predictive modeling. Users can leverage built-in statistical functions and algorithms for data exploration. Tableau's integration with machine learning models allows for automated insights and recommendations. | ||
| 6 | ||
| Mobile and Responsive Design | ||
|---|---|---|
| Tableau offers a mobile app for accessing and interacting with dashboards on smartphones and tablets. Visualizations are automatically optimized for different screen sizes and orientations. Users can design responsive dashboards that adapt to different devices and resolutions. | ||
| 7 | ||

| Security and Governance | ||
|---|---|---|
| Tableau provides robust security features to control access to data, dashboards, and reports. Administrators can manage user permissions, data sources, and content distribution. Tableau supports Single Sign-On (SSO) integration and encryption for data protection. | ||
| 8 | ||
| Training and Support | ||
|---|---|---|
| Tableau offers comprehensive training resources, including online tutorials, webinars, and certification programs. The Tableau community provides forums and user groups for sharing knowledge and troubleshooting. Tableau's customer support team provides assistance and guidance for technical issues. | ||
| 9 | ||

| Conclusion | ||
|---|---|---|
| Tableau is a versatile and user-friendly data visualization tool. It empowers users to explore, analyze, and share insights from their data. With its rich features and intuitive interface, Tableau is a valuable asset for businesses and professionals alike. | ||
| 10 | ||