Ppt On Energy Consumption Dashboard Using Data Structures Concept In C Presentation
| Introduction | ||
|---|---|---|
| Energy Consumption Dashboard using Data Structures in C. Importance of monitoring and managing energy consumption. Overview of data structures concept in C. | ||
| 1 | ||

| What is an Energy Consumption Dashboard? | ||
|---|---|---|
| An energy consumption dashboard is a visual representation of energy usage. It provides real-time data on energy consumption. Helps users to identify patterns, trends, and areas for improvement. | ||
| 2 | ||
| Why Use Data Structures? | ||
|---|---|---|
| Data structures allow efficient storage and retrieval of energy consumption data. Helps in organizing and managing large amounts of data. Enables quick access and analysis of energy consumption metrics. | ||
| 3 | ||

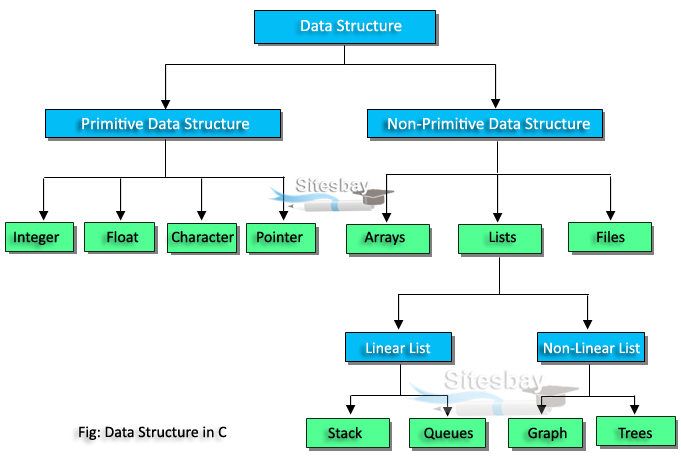
| Types of Data Structures Used | ||
|---|---|---|
| Linked List: Efficient for storing and manipulating sequential energy consumption data. Hash Table: Enables fast retrieval of energy consumption data based on specific criteria. Tree: Useful for organizing and categorizing energy consumption data hierarchically. | ||
| 4 | ||
| Implementation of Linked List | ||
|---|---|---|
| Each node in the linked list represents an energy consumption record. Nodes contain data fields such as date, time, energy consumption value. Supports operations like adding, deleting, and searching for energy consumption records. | ||
| 5 | ||

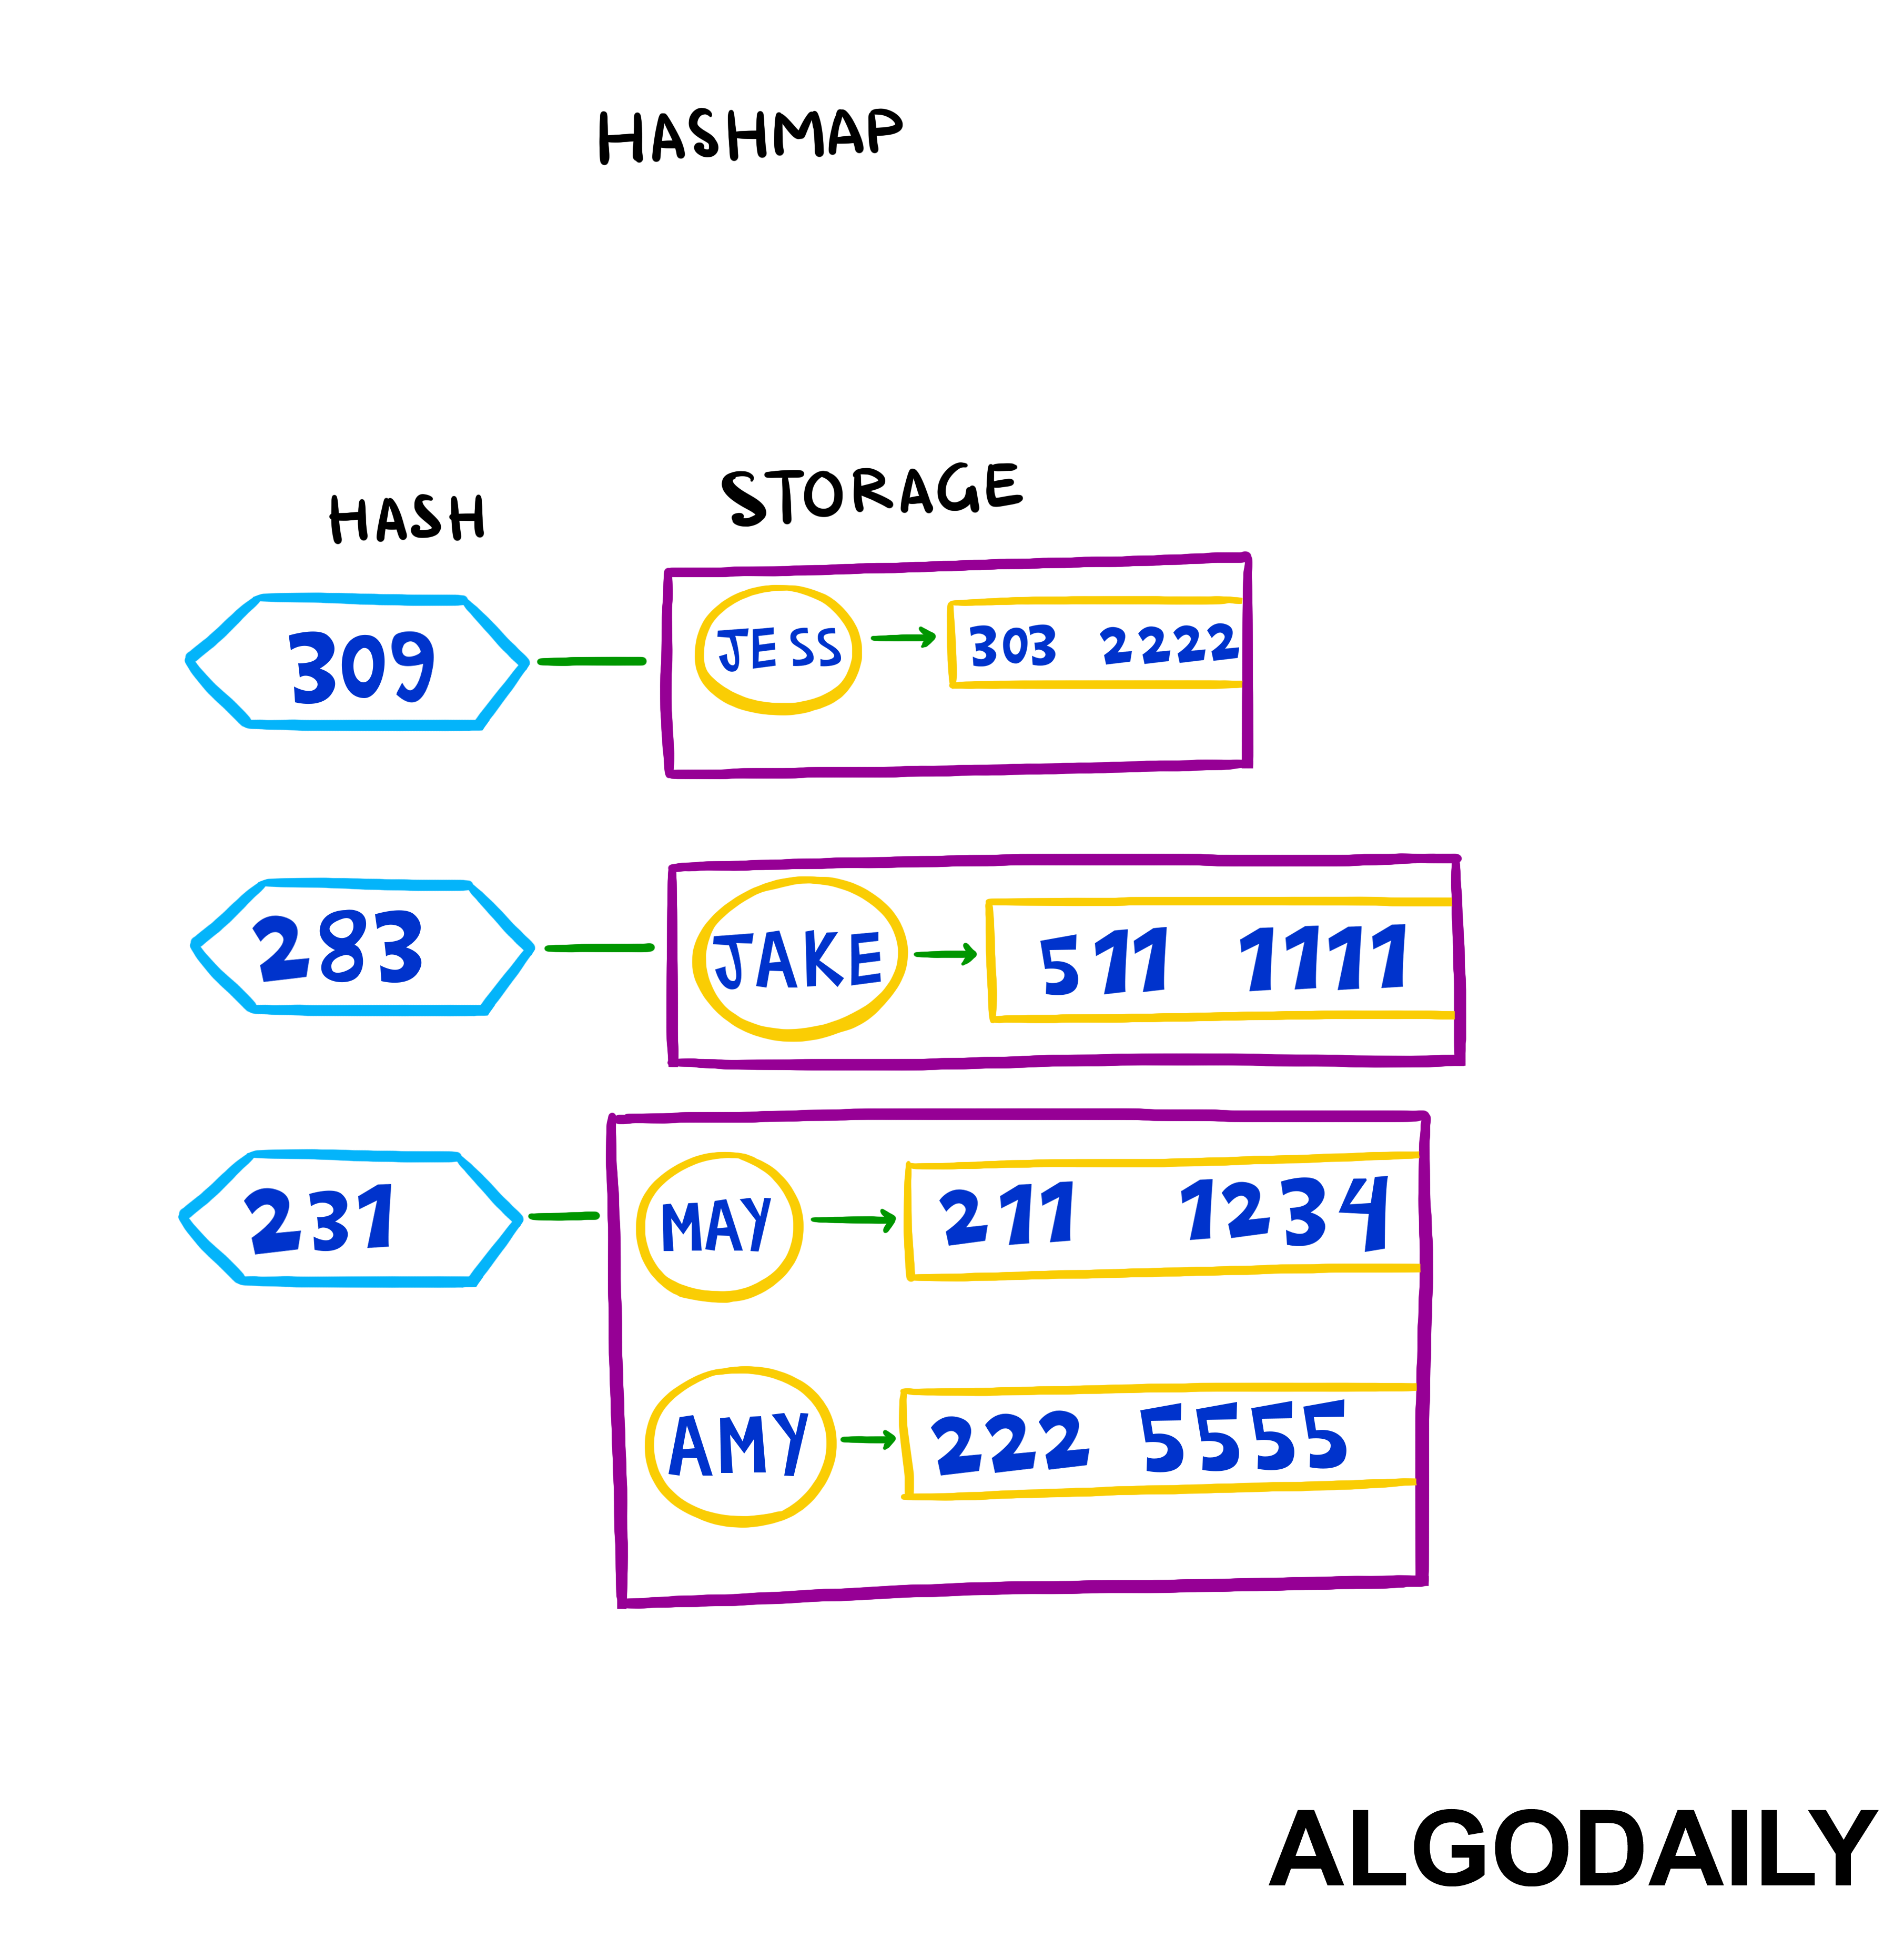
| Implementation of Hash Table | ||
|---|---|---|
| Energy consumption data is stored in buckets based on a specific key, such as date or location. Hash function maps the key to the corresponding bucket for quick retrieval. Allows efficient searching and retrieval of energy consumption data. | ||
| 6 | ||
| Implementation of Tree | ||
|---|---|---|
| Energy consumption data is organized in a hierarchical structure. Each node in the tree represents a category or subcategory of energy consumption. Enables easy navigation and analysis of energy consumption data based on different levels of granularity. | ||
| 7 | ||

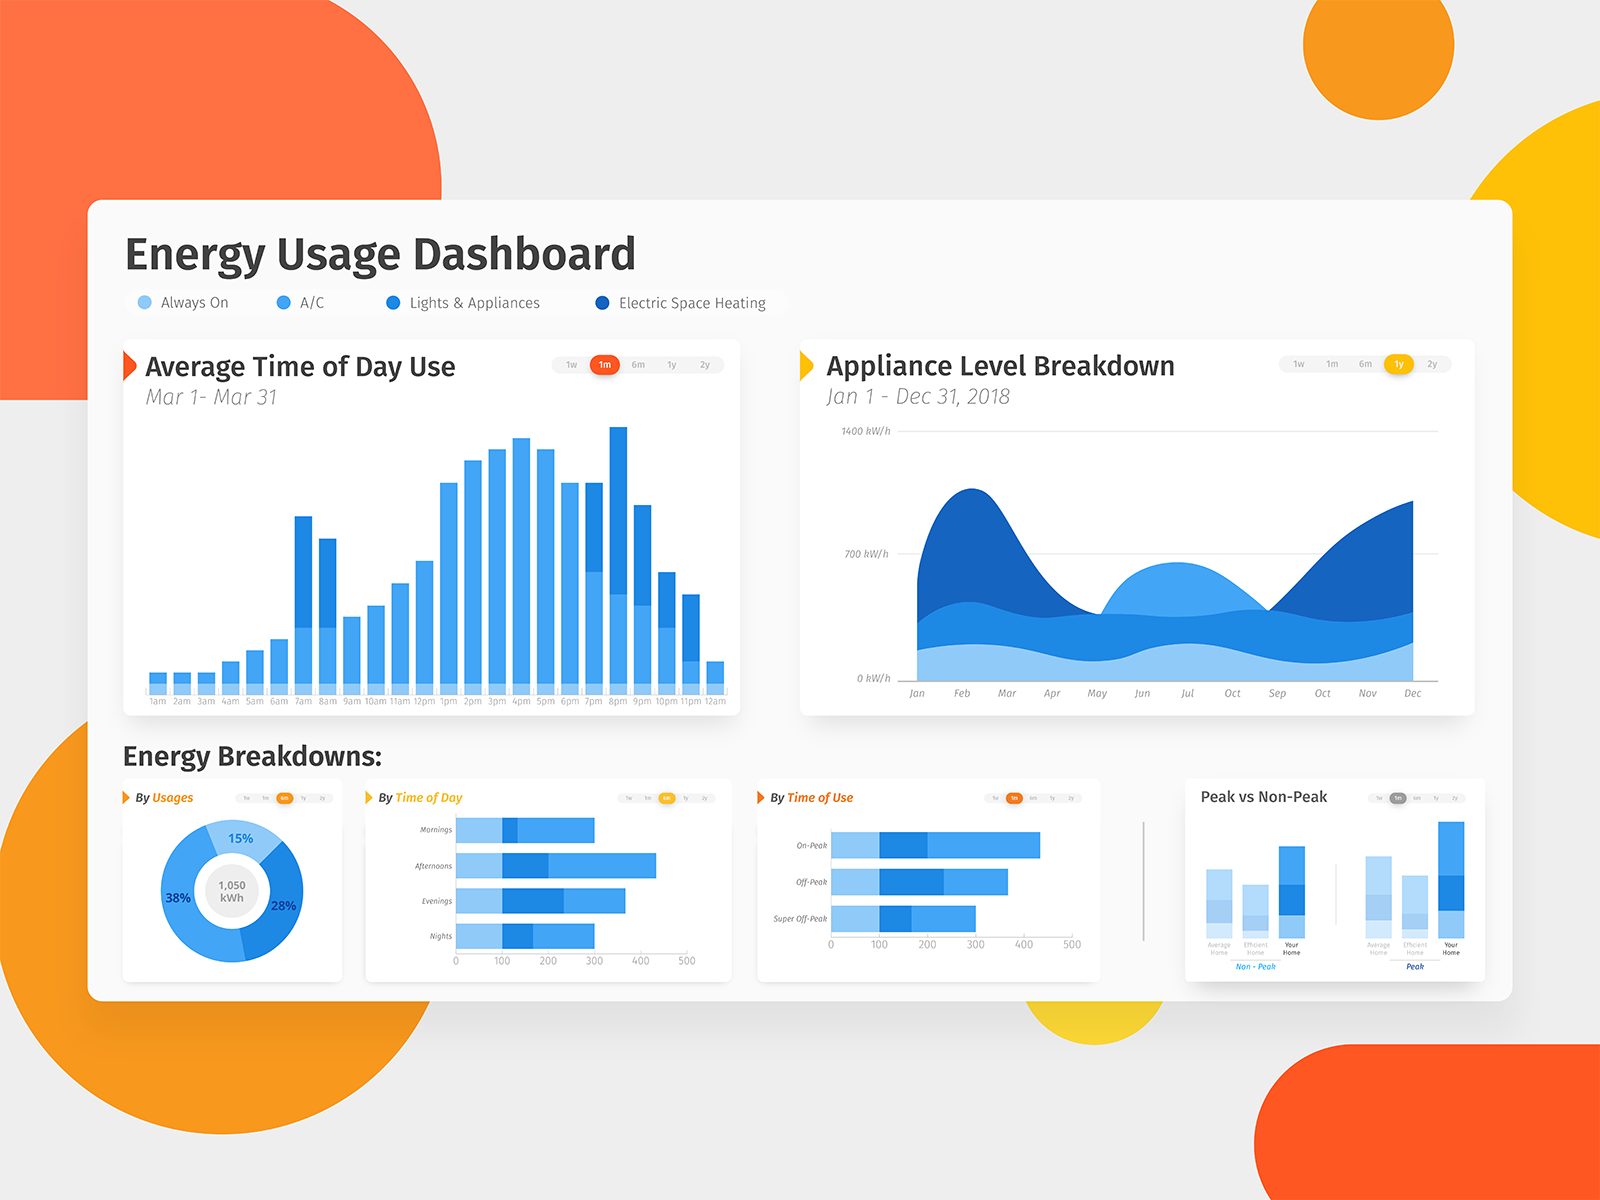
| User Interface of Energy Consumption Dashboard | ||
|---|---|---|
| Visual representation of energy consumption data using charts, graphs, and tables. Intuitive interface for users to interact with and analyze energy consumption metrics. Allows customization of data display based on individual preferences. | ||
| 8 | ||
| Benefits of Energy Consumption Dashboard | ||
|---|---|---|
| Enables users to identify energy-saving opportunities and take corrective actions. Provides insights on energy consumption patterns to optimize usage. Facilitates cost savings and reduces environmental impact. | ||
| 9 | ||

| Conclusion | ||
|---|---|---|
| Energy consumption dashboard using data structures in C is an effective tool for monitoring and managing energy usage. Data structures like linked lists, hash tables, and trees enable efficient storage and retrieval of energy consumption data. The user interface of the dashboard provides a visual representation of energy consumption metrics for easy analysis and decision-making. | ||
| 10 | ||
