Discriminant Analysis Presentation
| Introduction to Discriminant Analysis | ||
|---|---|---|
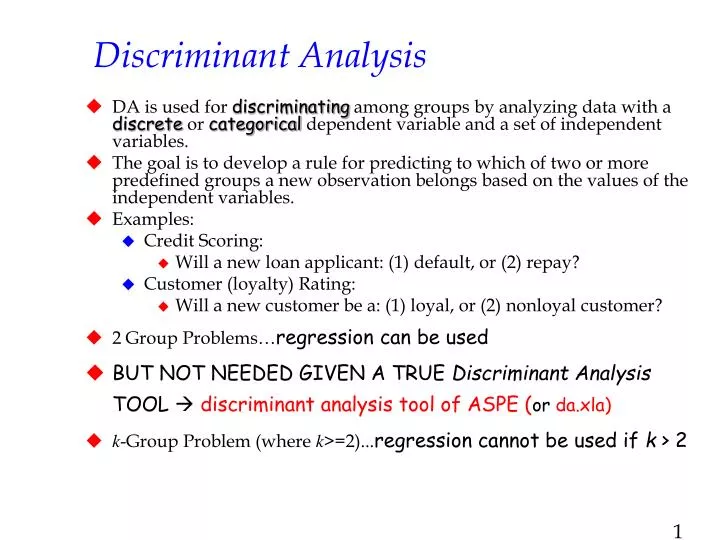
| Discriminant analysis is a statistical technique used to classify objects or cases into two or more pre-defined groups based on a set of predictor variables. It is commonly used in various fields, including social sciences, marketing, and finance, to understand the factors that differentiate groups and make accurate predictions. The goal of discriminant analysis is to find a linear combination of predictor variables that maximally separates the groups. | ||
| 1 | ||
| Types of Discriminant Analysis | ||
|---|---|---|
| Linear Discriminant Analysis (LDA): This is the most commonly used form of discriminant analysis. It assumes that the predictor variables are normally distributed and have equal covariance matrices across groups. Quadratic Discriminant Analysis (QDA): Unlike LDA, QDA relaxes the assumption of equal covariance matrices and allows for different variances and covariances across groups. It is more flexible but requires a larger sample size. Regularized Discriminant Analysis (RDA): RDA is a modified version of LDA that handles situations where the number of predictor variables is larger than the number of observations. It uses regularization techniques to prevent overfitting. |  | |
| 2 | ||
| Assumptions of Discriminant Analysis | ||
|---|---|---|
| Normality: Discriminant analysis assumes that the predictor variables are normally distributed within each group. Deviations from normality can affect the accuracy of the classification. Linearity: It assumes that the relationships between the predictor variables and the discriminant function are linear. Non-linear relationships may require alternative methods such as non-linear discriminant analysis. Homoscedasticity: Homoscedasticity assumes that the variances of the predictor variables are equal across groups. Violations of this assumption may lead to biased classifications. |  | |
| 3 | ||
| Steps in Discriminant Analysis | ||
|---|---|---|
| Data Preparation: Collect and clean the data, ensuring that it meets the assumptions of discriminant analysis (e.g., normality, linearity, homoscedasticity). Variable Selection: Choose the predictor variables that are most relevant for classification. This can be done using techniques like stepwise selection or expert knowledge. Model Estimation: Estimate the discriminant function coefficients using maximum likelihood estimation or other appropriate methods. | ||
| 4 | ||
| Interpretation of Discriminant Analysis | ||
|---|---|---|
| Discriminant Function: The discriminant function represents the linear combination of predictor variables that maximally separates the groups. It can be used to classify new cases into the appropriate groups. Discriminant Loadings: These coefficients indicate the relative importance of each predictor variable in discriminating between groups. Larger loadings suggest stronger discriminatory power. Wilks' Lambda: This statistic measures the overall significance of the discriminant analysis. A smaller value indicates a more significant discrimination between groups. |  | |
| 5 | ||
| Benefits of Discriminant Analysis | ||
|---|---|---|
| Predictive Power: Discriminant analysis helps predict group membership based on the given predictor variables, allowing for accurate classification of future cases. Variable Importance: It identifies the most important predictor variables that contribute to group differentiation, aiding in understanding the key factors driving the classification. Data Reduction: Discriminant analysis can reduce a large number of predictor variables to a smaller set of discriminant functions, simplifying the analysis and interpretation. |  | |
| 6 | ||
| Applications of Discriminant Analysis | ||
|---|---|---|
| Market Segmentation: Discriminant analysis is widely used in marketing research to identify segments of customers based on their purchasing behaviors, demographics, or psychographic characteristics. Credit Risk Assessment: Discriminant analysis helps financial institutions assess the creditworthiness of applicants by classifying them into high or low-risk categories based on financial indicators. Medical Diagnosis: Discriminant analysis assists in diagnosing diseases by classifying patients into different diagnostic groups using various medical measurements. |  | |
| 7 | ||
| Limitations of Discriminant Analysis | ||
|---|---|---|
| Assumption Sensitivity: Discriminant analysis relies on several assumptions, such as normality and linearity, which may not always hold in real-world datasets. Overfitting: In situations where the number of predictor variables exceeds the sample size, overfitting can occur, leading to poor generalization and inaccurate predictions. Multicollinearity: High correlations among predictor variables can affect the stability and interpretability of the discriminant function coefficients. |  | |
| 8 | ||
| Conclusion | ||
|---|---|---|
| Discriminant analysis is a powerful statistical technique used for classification and prediction tasks. It helps understand the factors that differentiate groups and make accurate predictions about new cases. By identifying important predictor variables and simplifying complex datasets, discriminant analysis provides valuable insights across various domains. | ||
| 9 | ||
| References (download PPTX file for details) | ||
|---|---|---|
| Author 1, Title of the Paper or Book, Journal... Author 2, Title of the Paper or Book, Journal... Author 3, Title of the Paper or Book, Journal... |  | |
| 10 | ||

