Diagrams For Passport Automation System Presentation
| Introduction to Diagrams for Passport Automation System | ||
|---|---|---|
| Diagrams are an essential visual tool for understanding and analyzing complex systems. Passport automation systems involve various interconnected components and processes. Diagrams help to visualize the flow of information and activities within the system. | ||
| 1 | ||

| Use Case Diagram | ||
|---|---|---|
| Use case diagrams depict the interactions between actors and the system. Actors in a passport automation system may include applicants, immigration officers, and passport printers. Use case diagrams help identify the different tasks and functionalities performed by each actor. | ||
| 2 | ||

| Activity Diagram | ||
|---|---|---|
| Activity diagrams illustrate the flow of activities within a specific process or workflow. In a passport automation system, an activity diagram can represent the steps involved in passport application processing. Activity diagrams help to identify the sequence of actions and decision points within the system. | ||
| 3 | ||

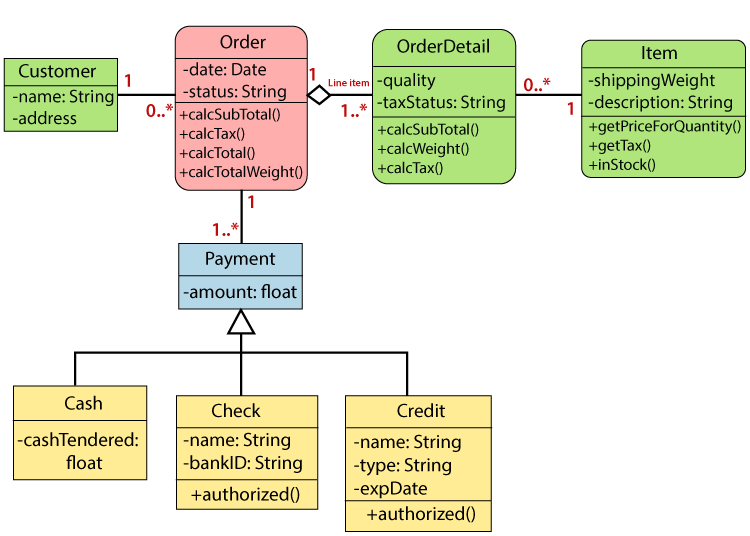
| Class Diagram | ||
|---|---|---|
| Class diagrams provide a high-level overview of the structure and relationships between classes or objects in a system. In a passport automation system, classes may include passport application, applicant, immigration officer, and passport printer. Class diagrams help to identify the attributes and methods associated with each class and their relationships. | ||
| 4 | ||
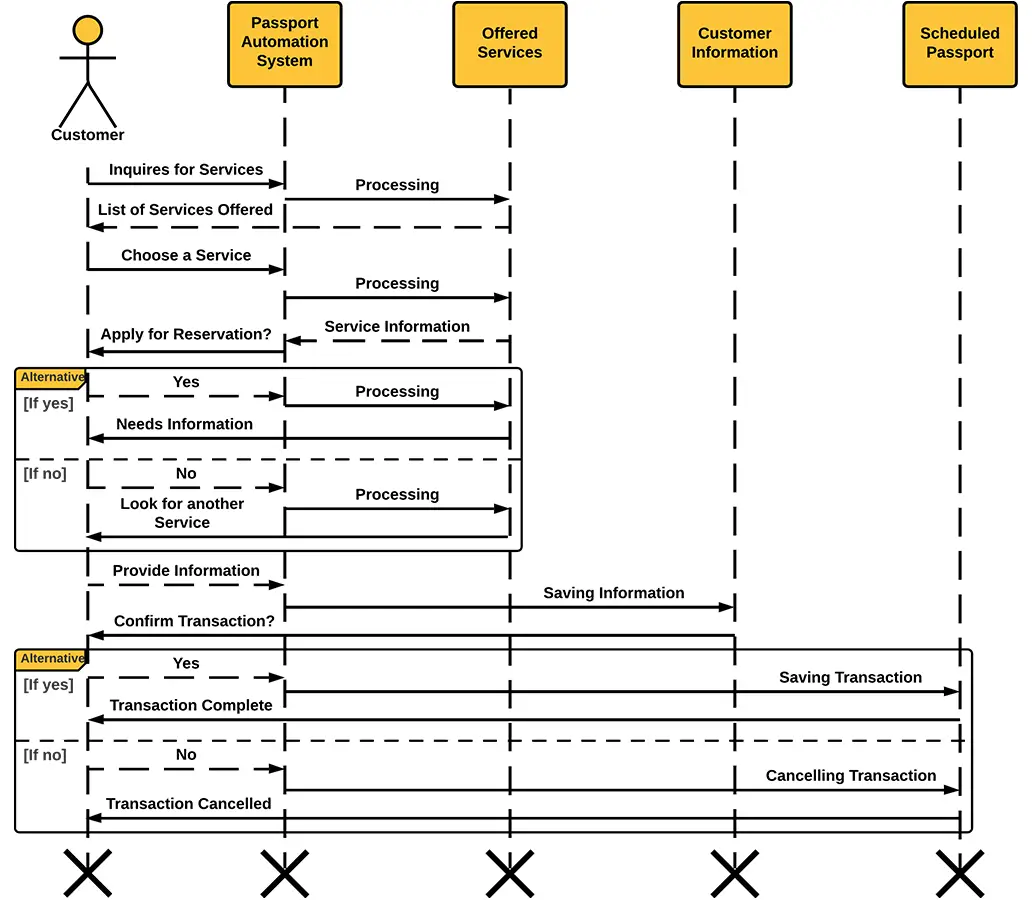
| Sequence Diagram | ||
|---|---|---|
| Sequence diagrams show the interactions between objects or components over time. In a passport automation system, a sequence diagram can represent the interactions between an applicant, an immigration officer, and a passport printer during the application process. Sequence diagrams help to understand the order of messages and the time required to complete each task. | ||
| 5 | ||
| State Diagram | ||
|---|---|---|
| State diagrams illustrate the different states that an object can go through during its lifecycle. In a passport automation system, a state diagram can represent the different states of a passport application, such as "submitted," "under review," and "approved." State diagrams help to identify the events and conditions that trigger state transitions. | ||
| 6 | ||

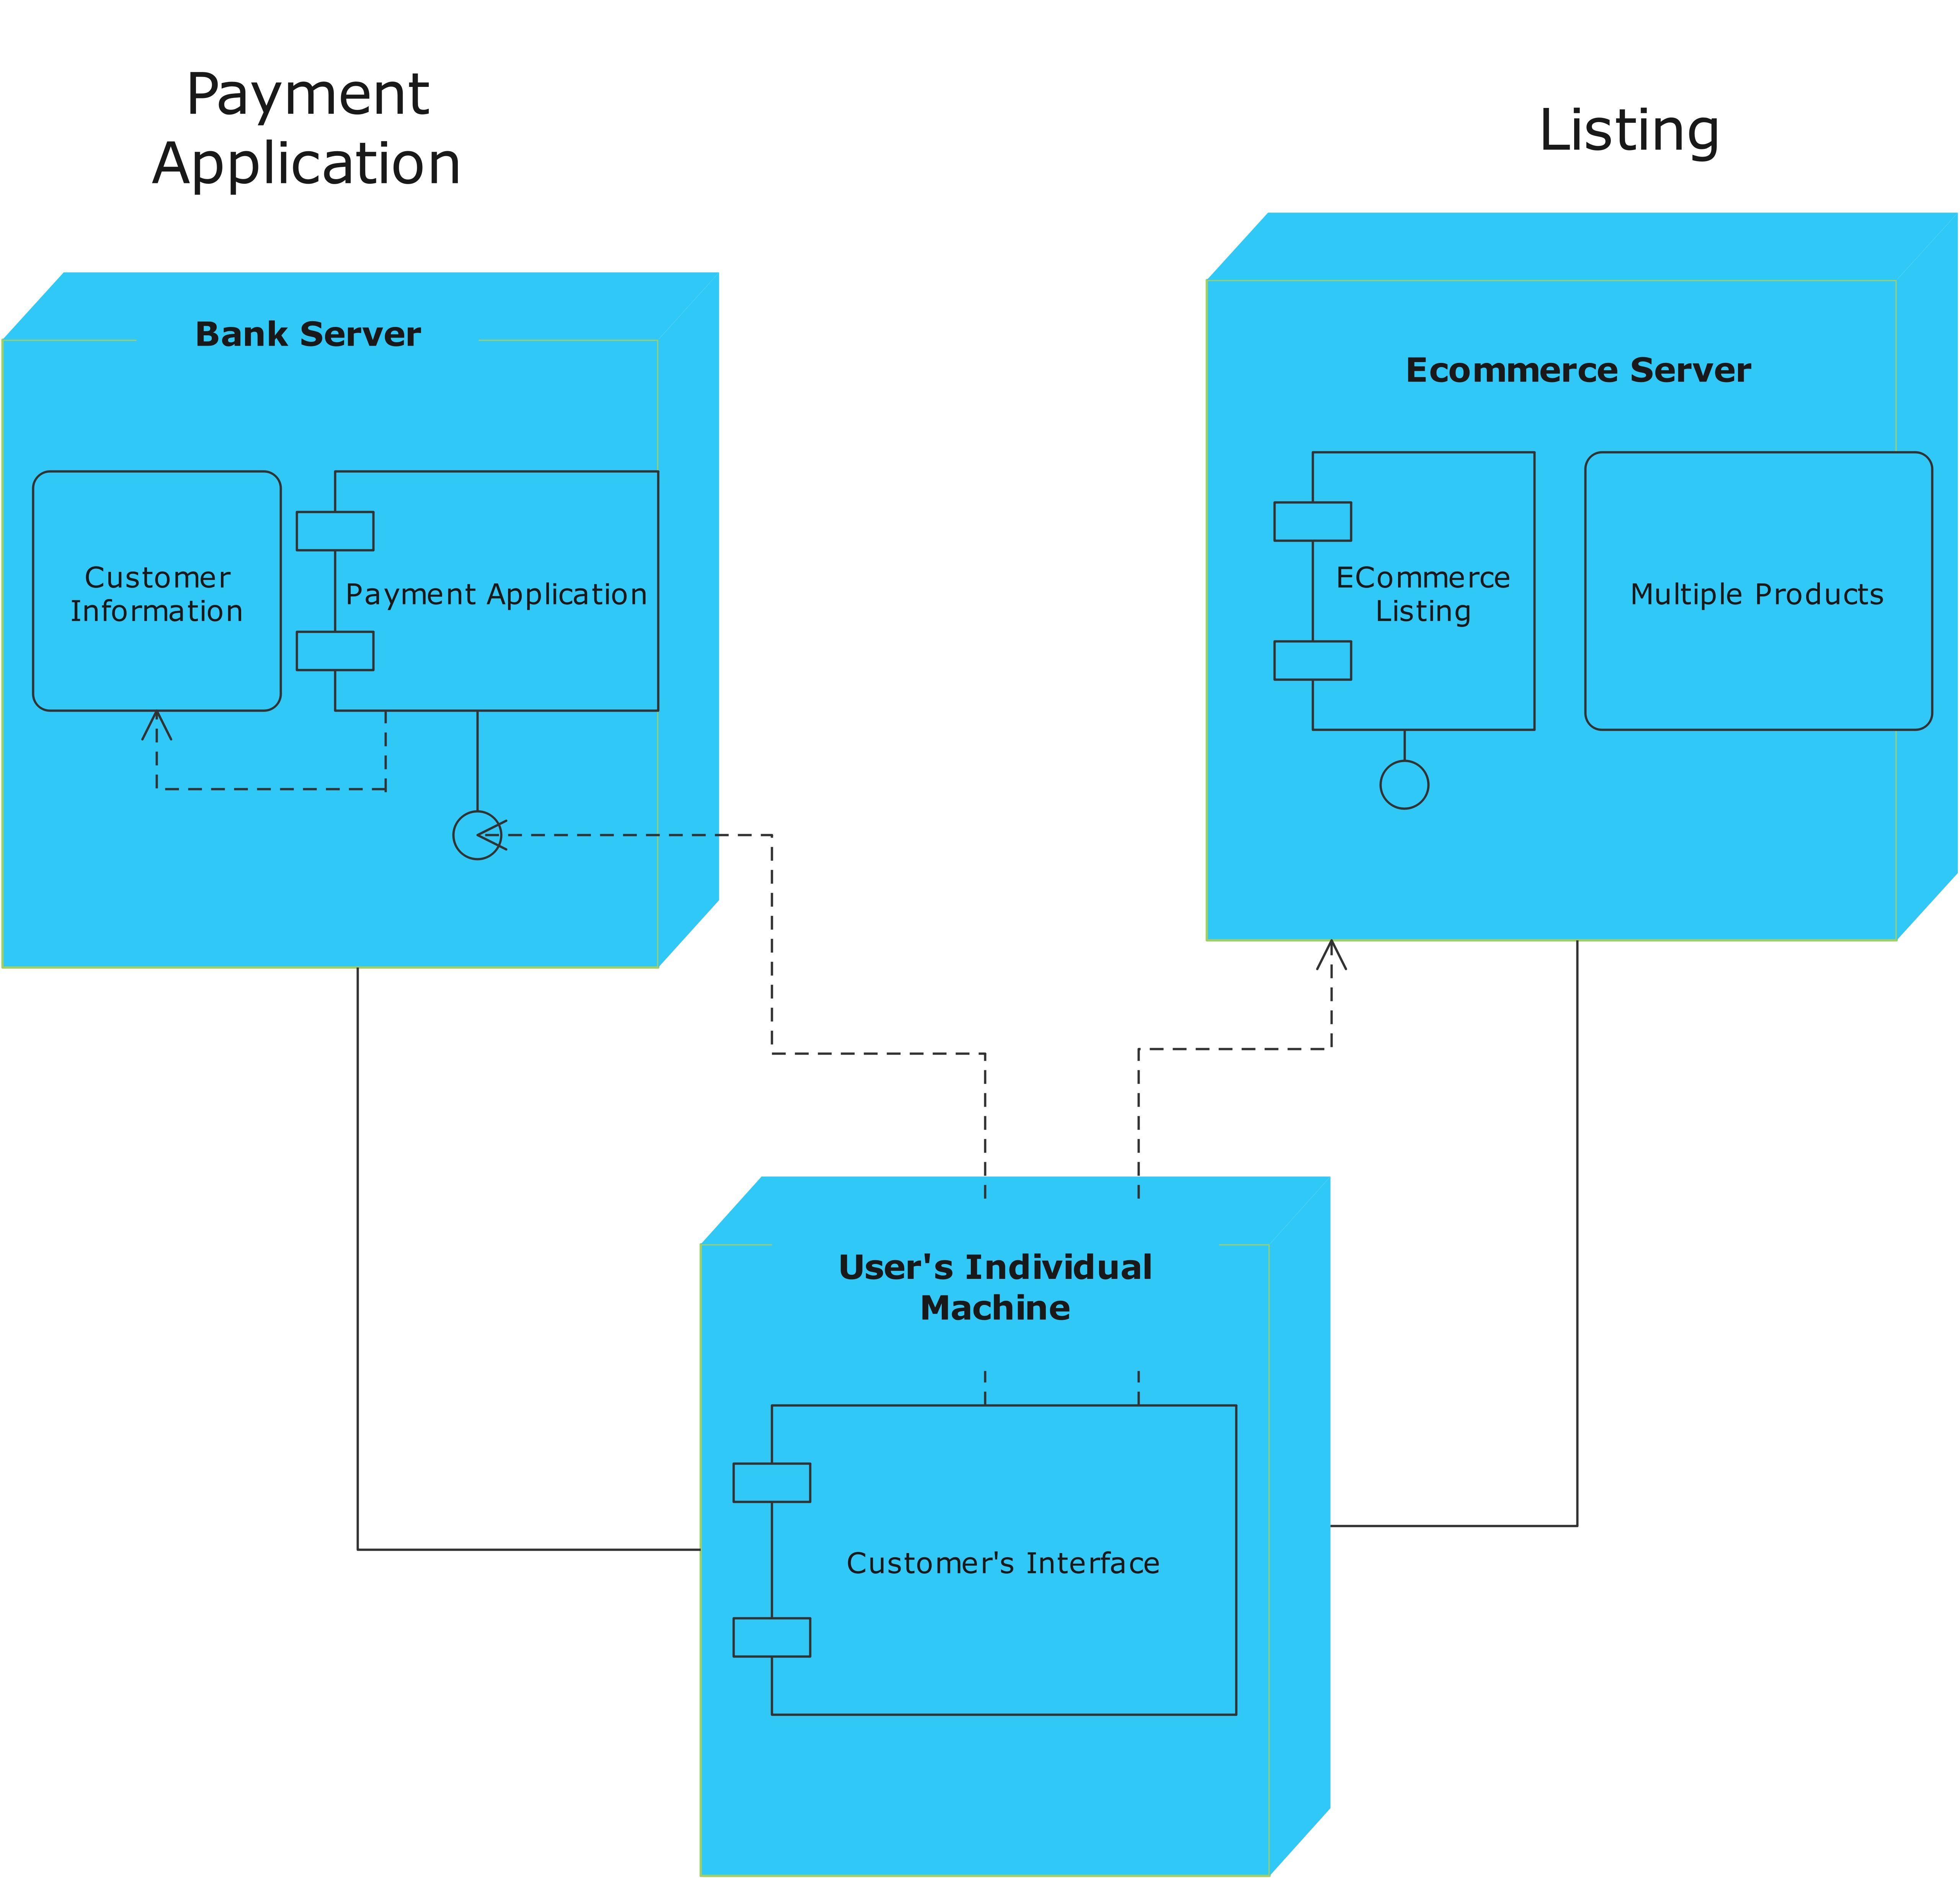
| Component Diagram | ||
|---|---|---|
| Component diagrams depict the physical or logical components of a system and their dependencies. In a passport automation system, components may include the application server, database, user interface, and external services. Component diagrams help to understand the overall architecture and the relationships between different components. | ||
| 7 | ||

| Deployment Diagram | ||
|---|---|---|
| Deployment diagrams show how software components are deployed on hardware or infrastructure. In a passport automation system, a deployment diagram can represent the distribution of components across servers, networks, and devices. Deployment diagrams help to understand the physical deployment and scalability of the system. | ||
| 8 | ||
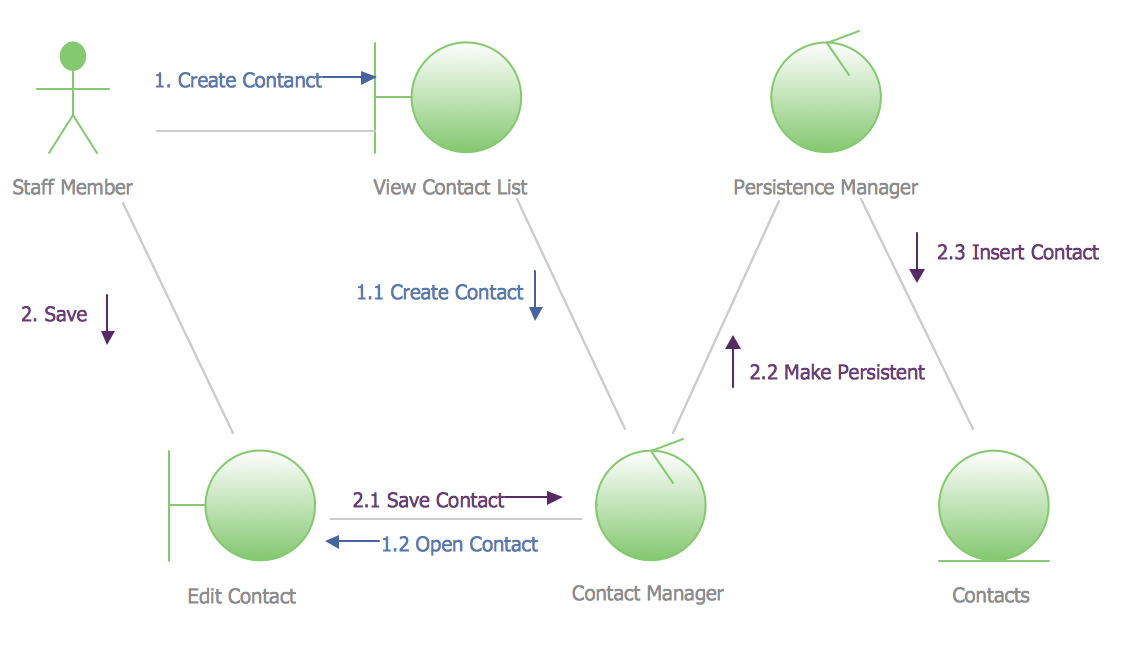
| Collaboration Diagram | ||
|---|---|---|
| Collaboration diagrams illustrate the interactions between objects or components to achieve a specific goal. In a passport automation system, a collaboration diagram can represent the interactions between different components involved in the application processing. Collaboration diagrams help to understand the dynamic interactions between components. | ||
| 9 | ||
| Summary and Conclusion | ||
|---|---|---|
| Diagrams play a crucial role in understanding, designing, and analyzing passport automation systems. Use case, activity, class, sequence, state, component, deployment, and collaboration diagrams are commonly used in this context. By using these diagrams effectively, system stakeholders can gain a better understanding of the system's functionality, structure, and behavior. | ||
| 10 | ||

| References (download PPTX file for details) | ||
|---|---|---|
| Reference 1: Smith, J. (2020). "Passport Auto... Reference 2: Johnson, A. (2018). "Diagramming... Reference 3: Brown, K. et al. (2019). "Design... |  | |
| 11 | ||