Candlestick Presentation
| Introduction to Candlestick | ||
|---|---|---|
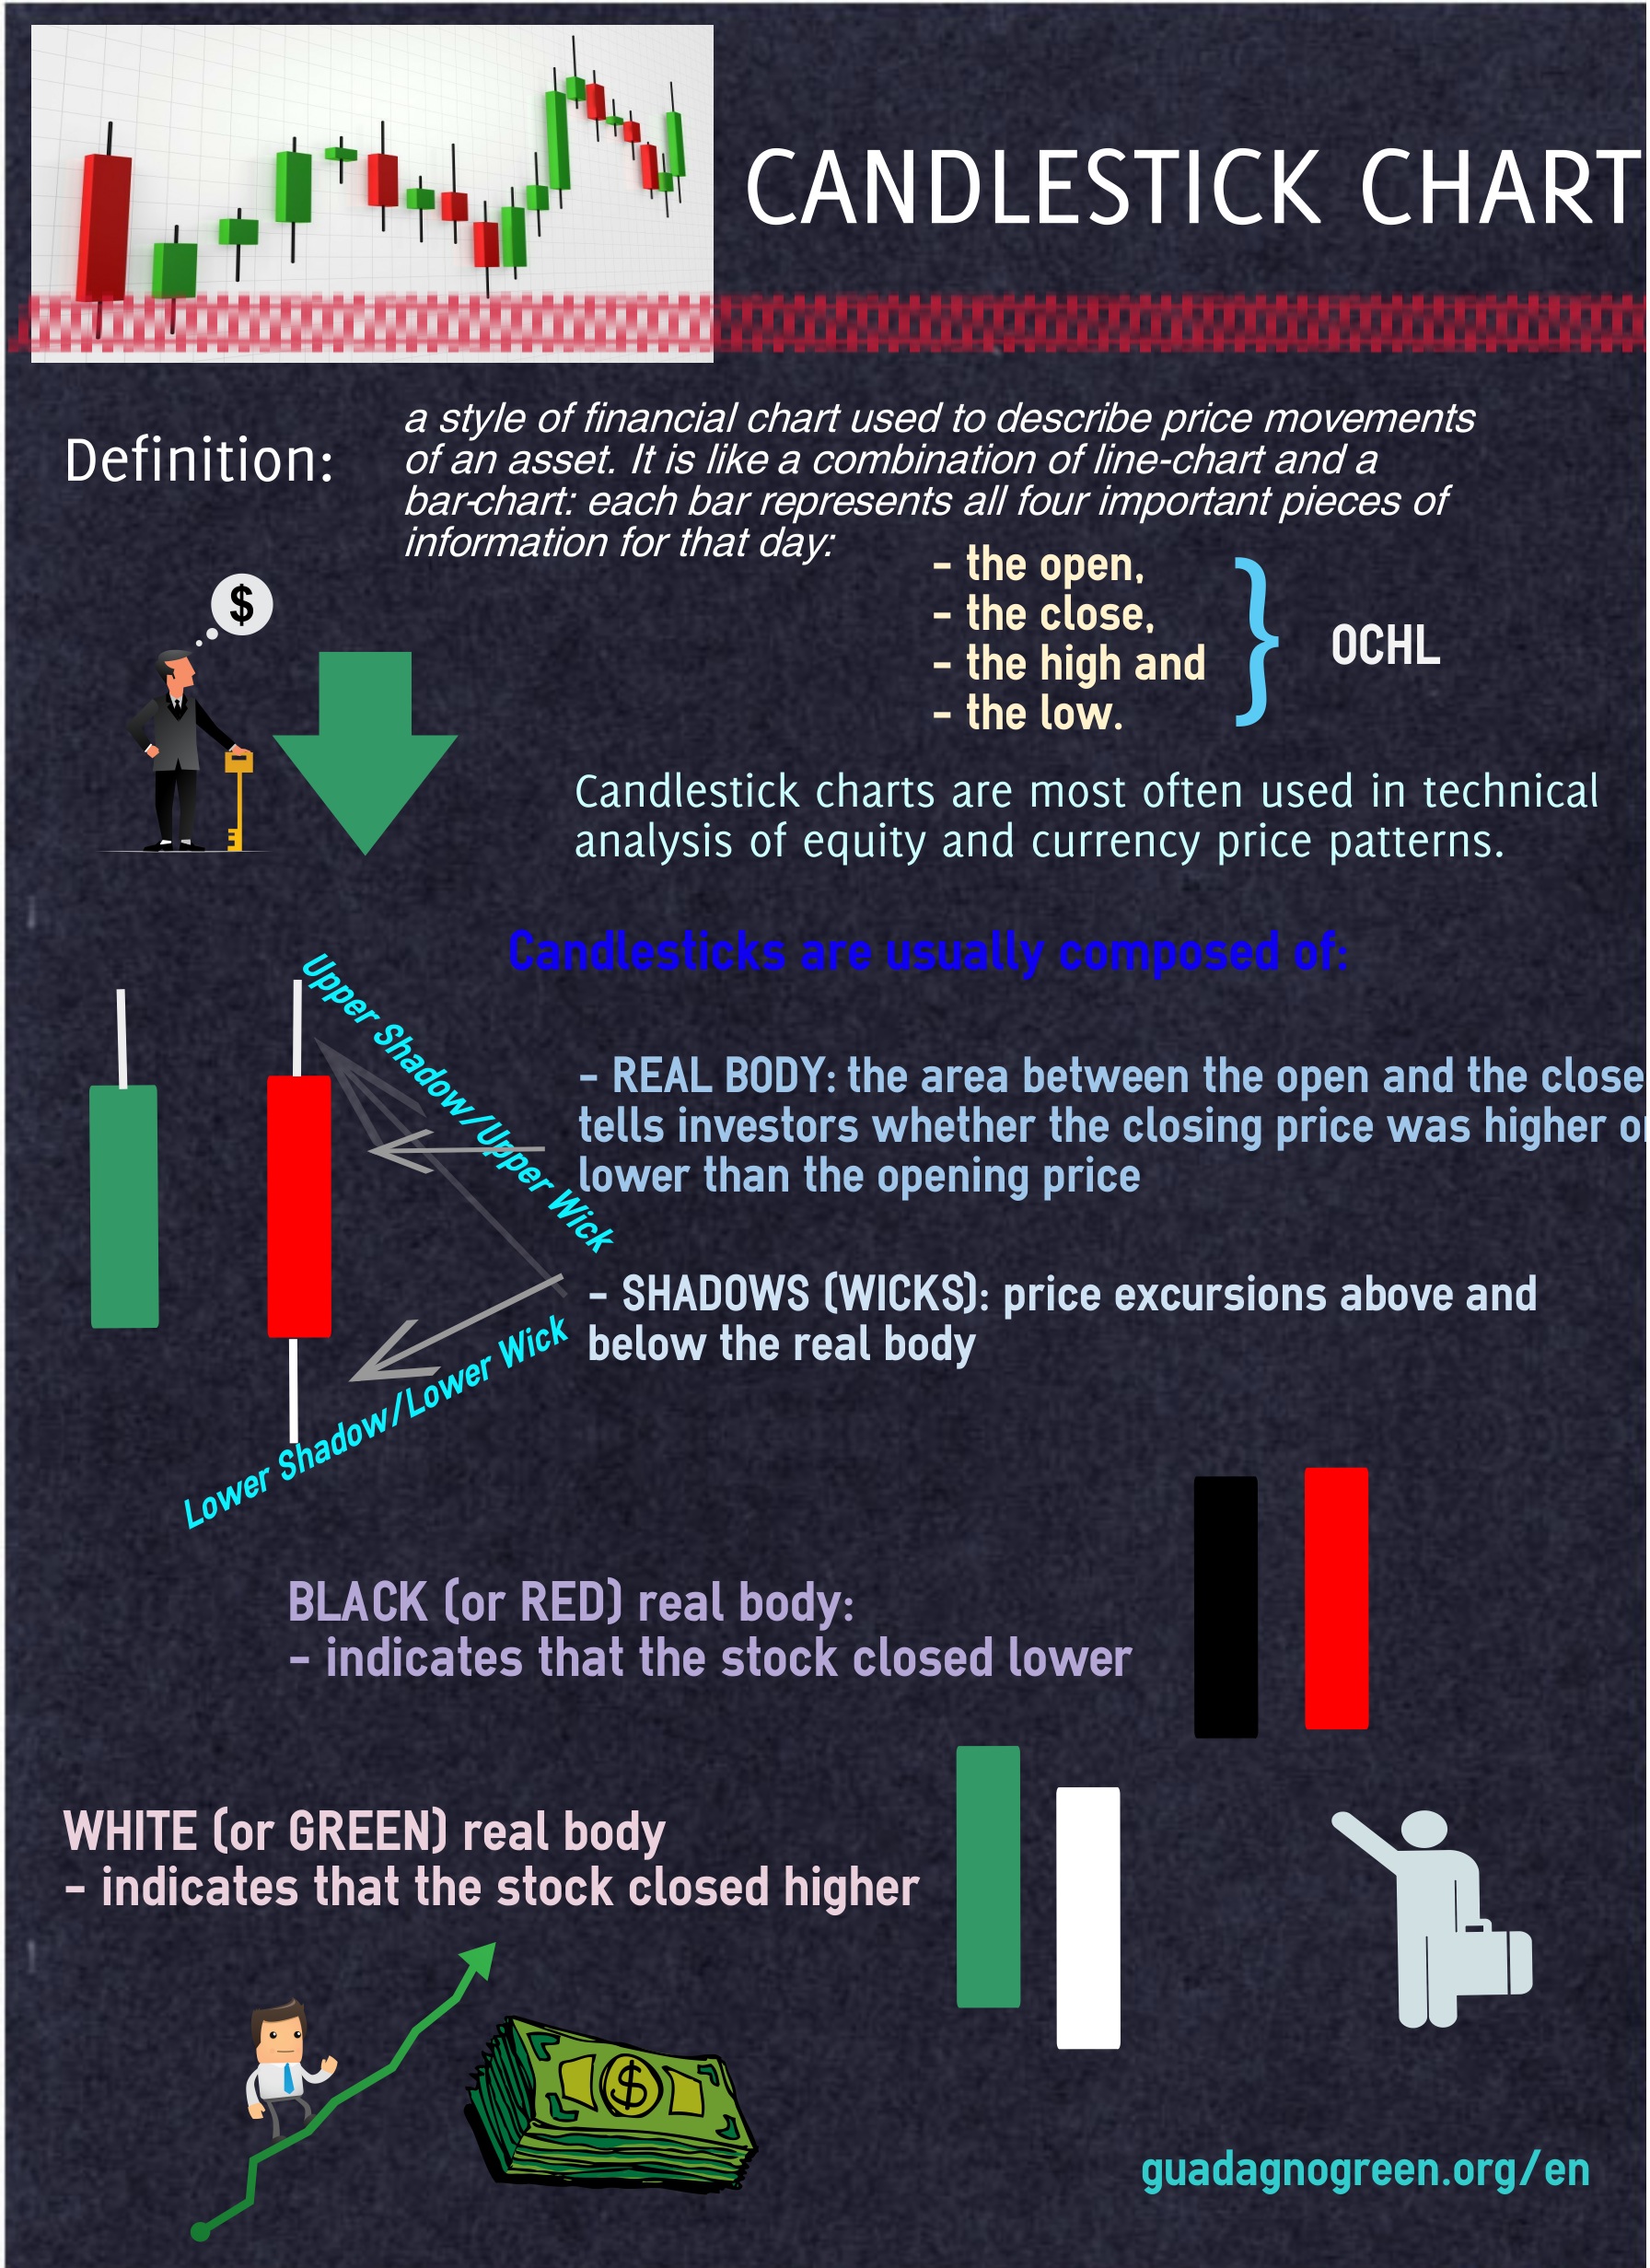
| Candlestick is a popular charting technique used in technical analysis. It originated in Japan and has been used for centuries to predict price movements. Candlestick charts provide valuable information about the open, high, low, and close prices of an asset over a specific time period. | ||
| 1 | ||
| Anatomy of a Candlestick | ||
|---|---|---|
| A candlestick consists of a body and two wicks, also known as shadows. The body represents the price range between the open and close of an asset. The wicks show the high and low prices reached during the time period. | ||
| 2 | ||

| Bullish Candlestick Patterns | ||
|---|---|---|
| Bullish candlestick patterns suggest a potential upward price movement. Examples of bullish patterns include the Hammer, Bullish Engulfing, and Morning Star. These patterns indicate buyers' dominance and a potential trend reversal. | ||
| 3 | ||

| Bearish Candlestick Patterns | ||
|---|---|---|
| Bearish candlestick patterns indicate a potential downward price movement. Examples of bearish patterns include the Shooting Star, Bearish Engulfing, and Evening Star. These patterns suggest sellers' dominance and a potential trend reversal. | ||
| 4 | ||
/AdvancedCandlestickPatterns1-f78d8e7eec924f638fcf49fab1fc90df.png)
| Doji Candlestick Pattern | ||
|---|---|---|
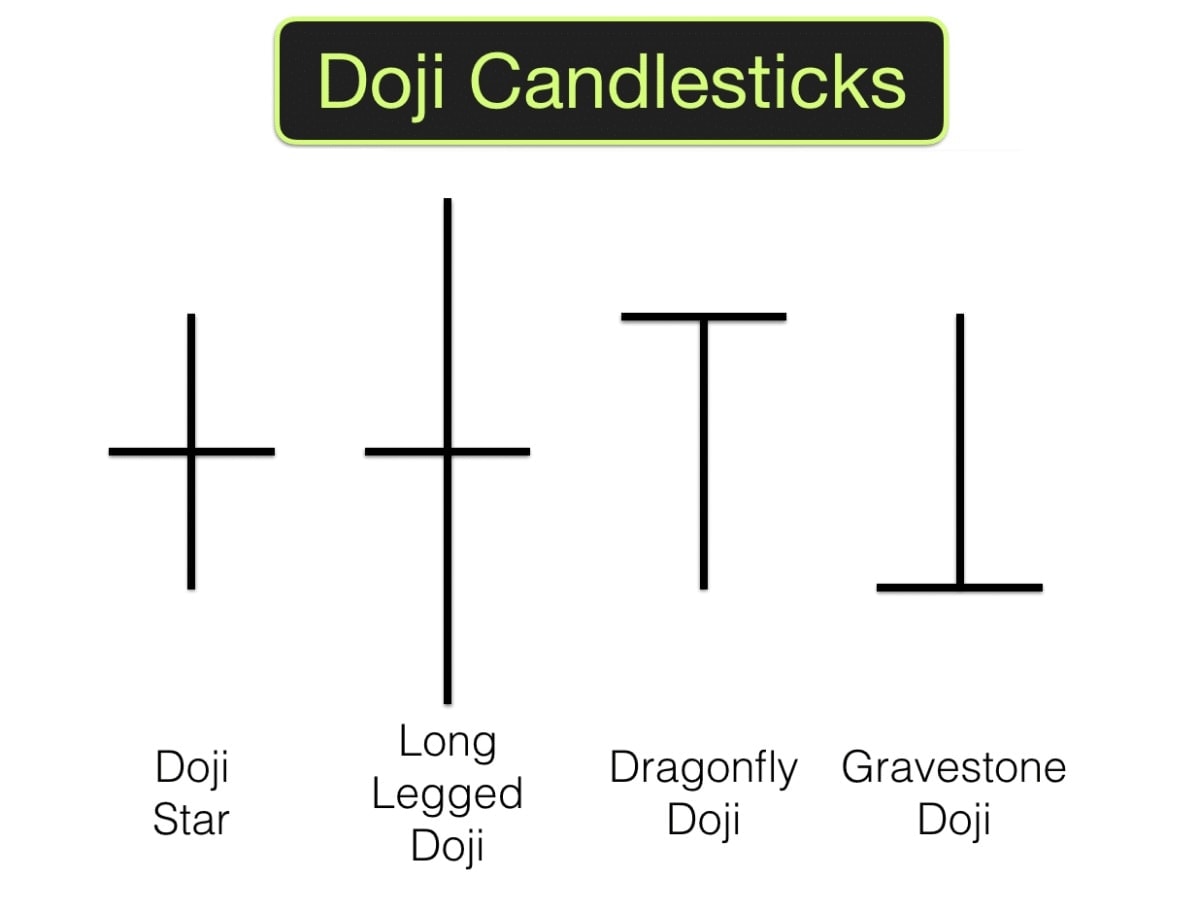
| Doji candlestick pattern occurs when the open and close prices are almost the same. It signifies market indecision and often precedes a trend reversal. Traders interpret the Doji pattern as a signal to be cautious and look for confirmation from other indicators. | ||
| 5 | ||
| Candlestick Patterns and Support/Resistance | ||
|---|---|---|
| Candlestick patterns can be used to identify support and resistance levels. A bullish pattern near a strong support level can indicate a potential bounce. A bearish pattern near a strong resistance level can suggest a potential price reversal. | ||
| 6 | ||

| Candlestick Patterns and Trend Continuation | ||
|---|---|---|
| Candlestick patterns can also provide insights into trend continuation. Bullish patterns during an uptrend suggest a potential continuation of the upward movement. Bearish patterns during a downtrend indicate a potential continuation of the downward movement. | ||
| 7 | ||

| Candlestick Patterns and Trading Strategies | ||
|---|---|---|
| Candlestick patterns can be used as standalone trading signals or in combination with other indicators. Traders often use candlestick patterns to determine entry and exit points for trades. Combining candlestick patterns with trendlines, moving averages, or oscillators can enhance trading strategies. | ||
| 8 | ||

| Conclusion | ||
|---|---|---|
| Candlestick analysis is a valuable tool for technical traders. Understanding different candlestick patterns can help in predicting future price movements. It is important to combine candlestick analysis with other technical analysis tools for more accurate trading decisions. | ||
| 9 | ||

| References (download PPTX file for details) | ||
|---|---|---|
| Nison, S. (1991). Japanese Candlestick Charti... Morris, G. (2006). Candlestick Charting Expla... Bulkowski, T. N. (2008). Encyclopedia of Cand... |  | |
| 10 | ||