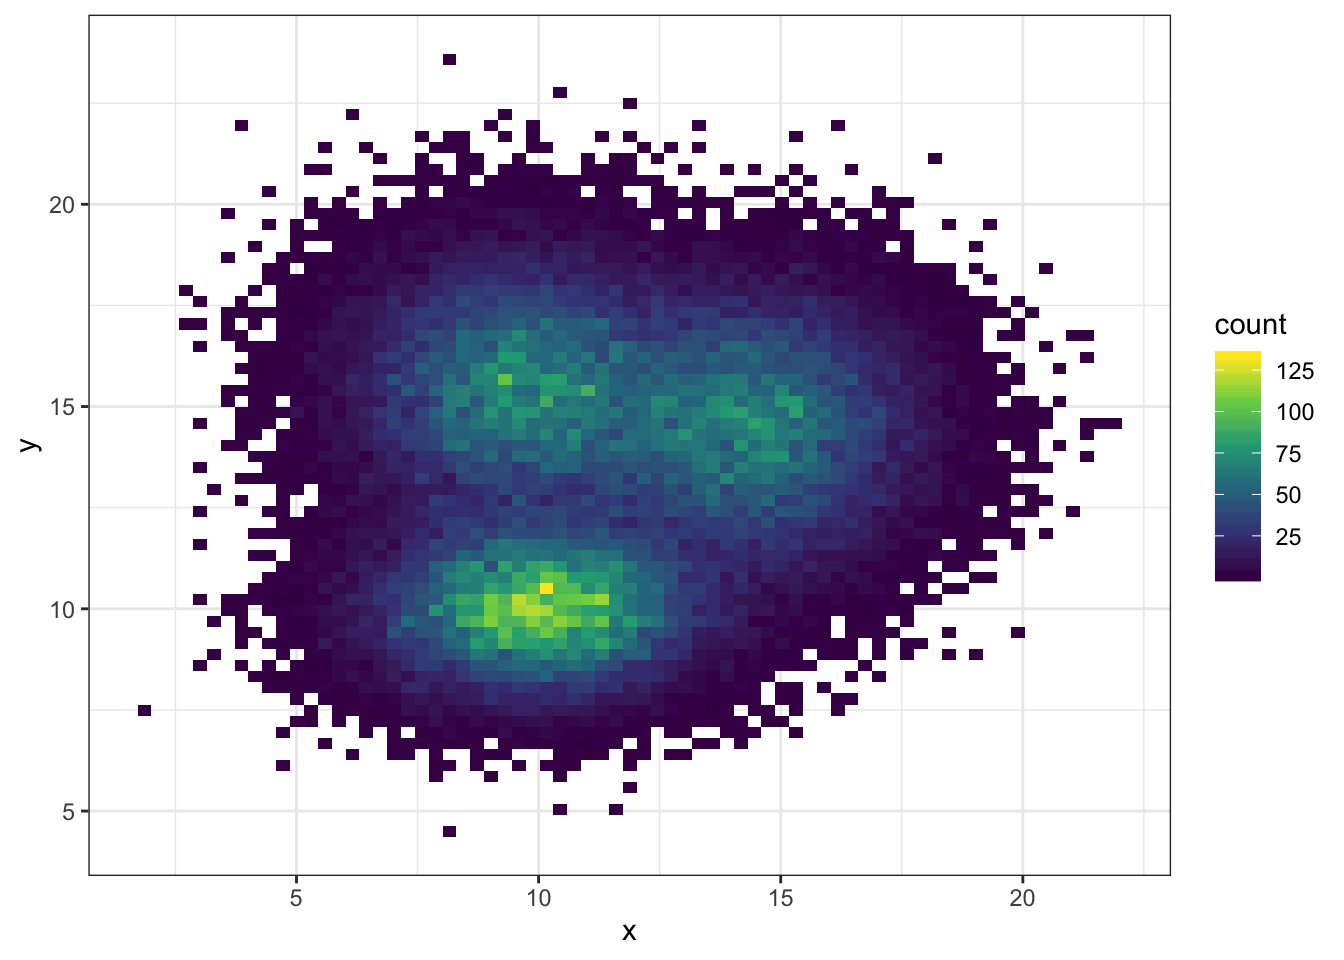
2D Density Plot Presentation
| Introduction to 2D Density Plot | ||
|---|---|---|
| A 2D density plot visualizes the density of data points in a two-dimensional space. It helps in understanding the distribution and patterns within the data. The plot is created by mapping the density of points to a color scale. | ||
| 1 | ||
| How to Create a 2D Density Plot | ||
|---|---|---|
| Start by choosing a suitable dataset with two numerical variables. Use a statistical software or programming language like Python or R to create the plot. Apply a kernel density estimation (KDE) algorithm to estimate the density of data points. | ||
| 2 | ||
| Interpreting a 2D Density Plot | ||
|---|---|---|
| The color intensity on the plot represents the density of points in a particular region. Darker areas indicate higher density, while lighter areas represent lower density. The contours on the plot indicate the boundaries of different density levels. | ||
| 3 | ||
| Benefits of 2D Density Plot | ||
|---|---|---|
| It helps in identifying areas of high concentration and outliers within the data. The plot allows for a visual assessment of the distribution and spread of data. It can be useful for exploring relationships between two variables. | ||
| 4 | ||
| Limitations of 2D Density Plot | ||
|---|---|---|
| The plot can be sensitive to the choice of bandwidth parameter in the KDE algorithm. It may become visually cluttered when dealing with large datasets. Interpretation of the plot can be subjective, and additional analysis may be required. | ||
| 5 | ||
| Use Cases for 2D Density Plot | ||
|---|---|---|
| It can be used in fields such as finance to analyze stock price movements. In biology, it can help visualize the spatial distribution of cells or organisms. It can also be used in social sciences to study patterns in demographic data. | ||
| 6 | ||
| Summary | ||
|---|---|---|
| A 2D density plot is a powerful visualization tool for understanding the density and distribution of data points in a two-dimensional space. It provides valuable insights into the relationships between variables and allows for the identification of patterns and outliers. Considerations should be made regarding the choice of dataset, software, and interpretation of the plot. | ||
| 7 | ||
| References (download PPTX file for details) | ||
|---|---|---|
| [Insert relevant references here]... Your second bullet... Your third bullet... |  | |
| 8 | ||


